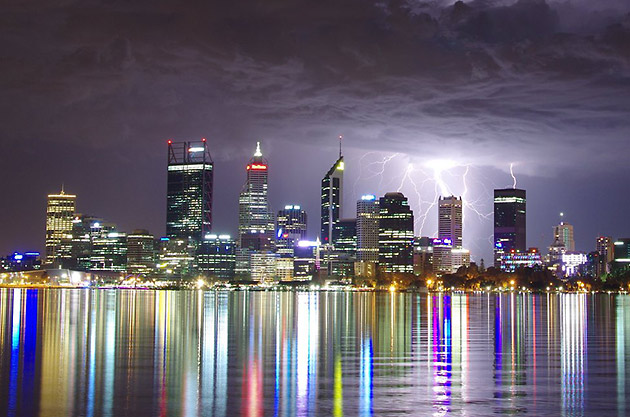
 Tim the con artist Flannery said back in 2004 that Perth would become the first 21st century ghost city due to global warming reducing rainfall resulting in us and the surrounding farmland running out of water.
Link: Perth rainfall and dam volumes.
He jumped on one of the lowest annual rainfalls on record that year of 400 and something mm (about 470mm from memory (official datasets are extremely difficult to find specific information) and also on an extended period where annual rainfall in Perth has decreased compared to the long term average.
The last time I managed to find the full info for each year that showed all daily amounts, something very interesting popped up:
Perth’s annual rainfall was not increased or decreased by big swings in the number of days where it rained. It was dictated by how many big storms it had each year. By “big”, I mean approx 100mm over 24 hours. We get an average of 3 a year. As our annual average rainfall is only about 800mm a year, these storms contribute 3/8ths of the total on average. So 3 days out of 365 days makes up 37.5% of our annual rainfall. If we get 4 days in a year, we get above average. If we get 2, we get below average.
I worked in the casino industry for 10 years, mainly dealing roulette. 37 numbers randomly popping up. I know that with 145 spins (we have 145 years of data) “trends” would appear. But they are not trends. It’s just random chance. I’ve seen the same number drop 6 times in a row on multiple occasions. I’ve seen red or black come up 16 times in a row.
The chance of a 100mm rainfall occurring on any specific day in the future is approximately 1/132. That means you can easily have periods where you go 600 days without having one. Or you could get 9 in a 365 day period. The average is 3. But in a chaotic non linear system, huge fluctuations either side of average that can repeat over extended periods of time, are expected not rare.
You can find Stephen Wells on Facebook and at Stephen Wells Triggers Everyone on Telegram.


