

This morning, data was released by the Office for National Statistics (ONS) relating to the 2021 census. The release is titled ‘Demography and migration: Census 2021 in England and Wales’.
The aim of this article is to give nationalists a quick overview of the important data held within the documents so they don’t have to dig through thousands of words themselves. This article is a joint effort by Patriotic Alternative and the team at White-Papers.
The full release, including further information on the methodology used and information relating to the strengths and limitations of the data, can be found on the ONS website.
The figures we will be discussing relate to England and Wales only (not to be confused with the whole of the United Kingdom).
Three publications have been released in total titled:
- Population and household estimates, England and Wales: Census 2021, unrounded data
- Household and resident characteristics, England and Wales: Census 2021
- International migration, England and Wales: Census 2021
Below we have listed the important information from each one.
Population and household estimates, England and Wales: Census 2021, unrounded data
- The usual resident population in England and Wales was 59,597,542.
- This includes 56,490,048 people in England and 3,107,494 people in Wales.
- This figure grew by more than 3.5 million (6.3%) since the last census (2011) when it was 56,075,912.
- Women make up 51% of the population and men make up 49% of the population.
- There are 24,783,199 households in England and Wales, an increase of 1.4 million (6.1%) since 2011.
- The median age in England and Wales was 40 years. It was 39 in 2011.
Household and resident characteristics, England and Wales: Census 2021
- The average household size in England and Wales is 2.4 people per household, the same as in 2011.
- The largest households on average are in London (2.5 residents per household) and the smallest households are in the North East (2.2 residents per household).
- The percentage of people aged 16 years and over who are married or in civil partnerships is 44.6%, a decrease from 46.8% in 2011.
- The percentage of people who have never married and have never been in a civil partnership has increased to 37.9%, from 34.6% in 2011.
International migration, England and Wales: Census 2021
- One in six usual residents of England and Wales were born outside the UK. This is an increase of 2.5 million since 2011, from 7.5 million (13.4%) to 10 million (16.8%).
- Out of the 59.6 million usual residents in England and Wales in 2021, 49.6 million (83.2%) were born in the UK and 10.0 million (16.8%) were born outside the UK.
- Of the 10.0 million residents in England and Wales in 2021 who were not born in the UK, 4.2 million (42.4%) had arrived since 2011, 2.7 million (26.9%) had arrived between 2001 and 2010 and 3.1 million (30.7%) had arrived before 2001.
- The most common age for people to be when they arrive in the UK is 18-29 years old (42.4% of migrants).
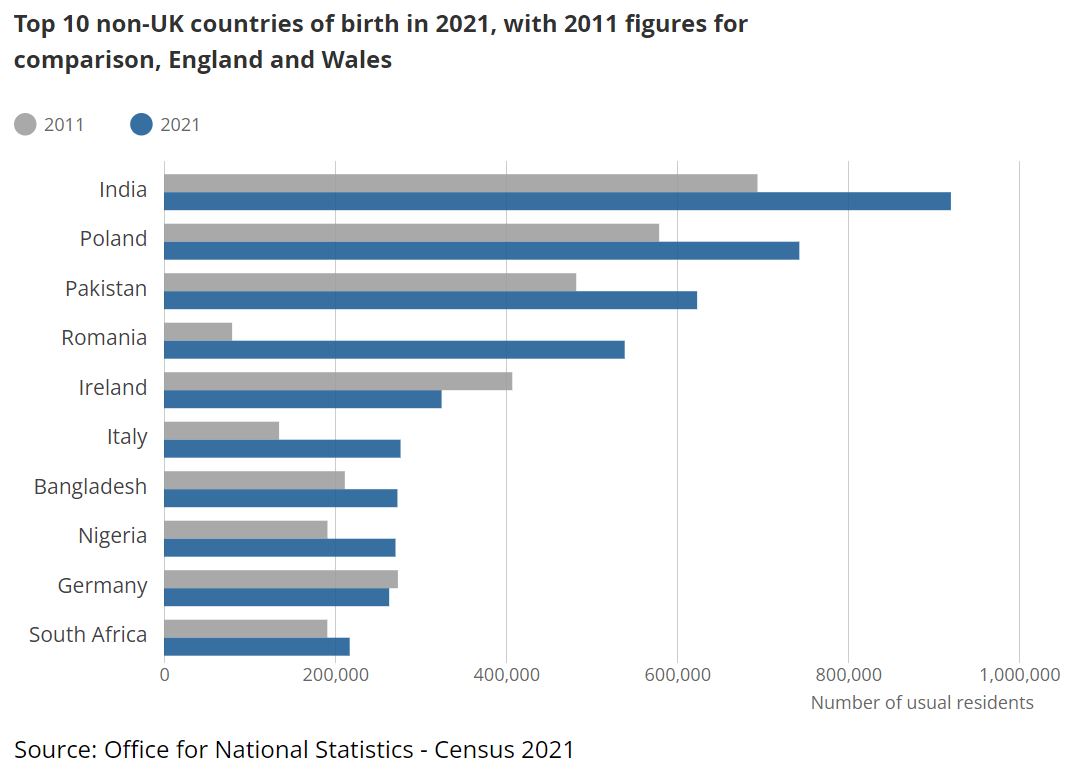
- The three most common non-UK countries of birth for usual residents in 2021 were the same as in 2011: India, Poland and Pakistan.
- India, which has increased to 920,000 (1.5% of the population in England and Wales), up from 694,000 in 2011.
- Poland, which has increased to 743,000 (1.2%), up from 579,000 in 2011.
- Pakistan, which has increased to 624,000 (1.0%), up from 482,000 in 2011.
- The number of people who were born in Romania grew by 576% since the previous census, from 80,000 in 2011 to 539,000 in 2021.
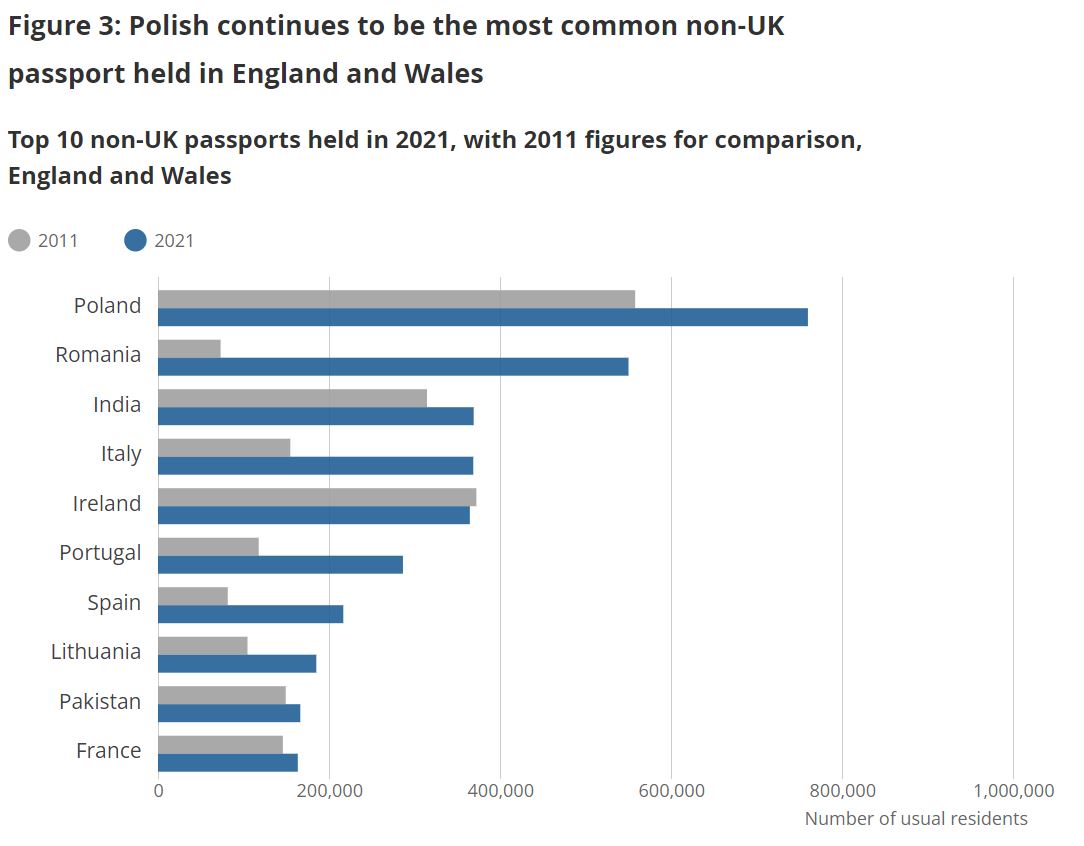
- 9 million people (9.9%) held a non-UK passport. The most common non-UK passport held was Polish (760,000 people, or 1.3% of all usual residents).
- 545,000 usual residents (0.9% of the population) have an address outside the UK.
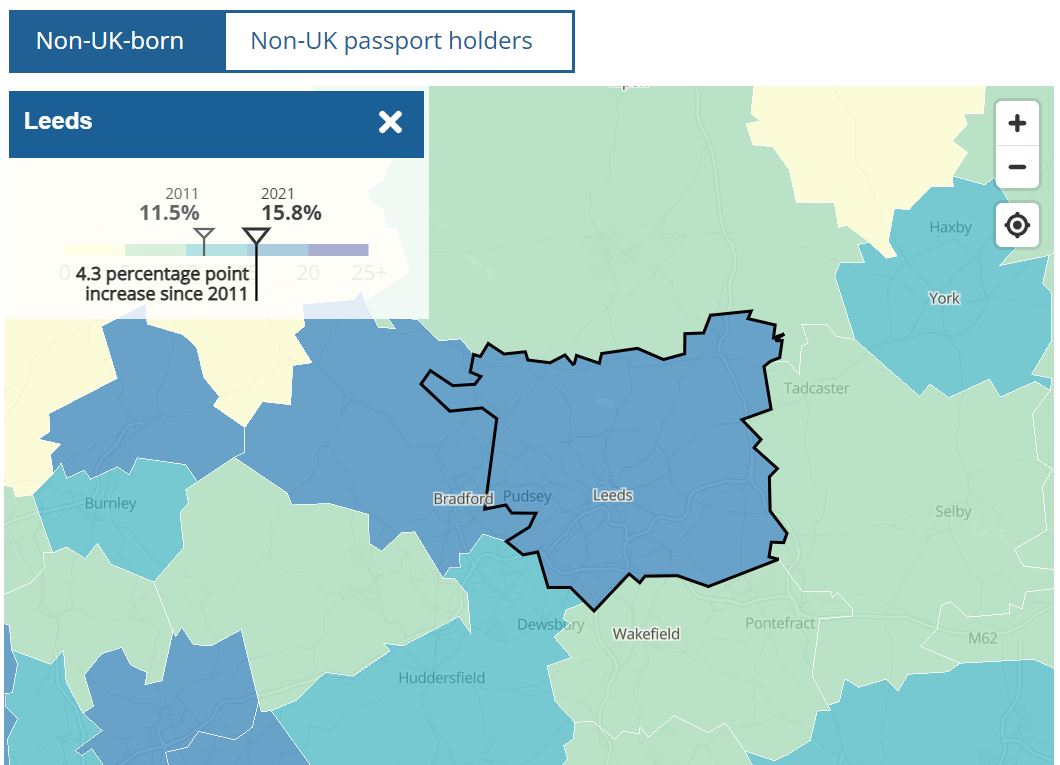
In this publication, there is an interactive map which can be used to determine the non-UK born population and non-UK passport holder population in your city. Please see the image below for an examples relating to Leeds, where the non-UK born population has increased from 11.5% in 2011 to 15.8% in 2021.
There is no data in this publication relating to ethnicity, however, a provisional date of 29th November 2022 has been set to publish a release titled, ‘Ethnic group, national identity, language and religion’.
Originally published at Patriotic Alternative on 2 November, 2022.


